|
Airport Data
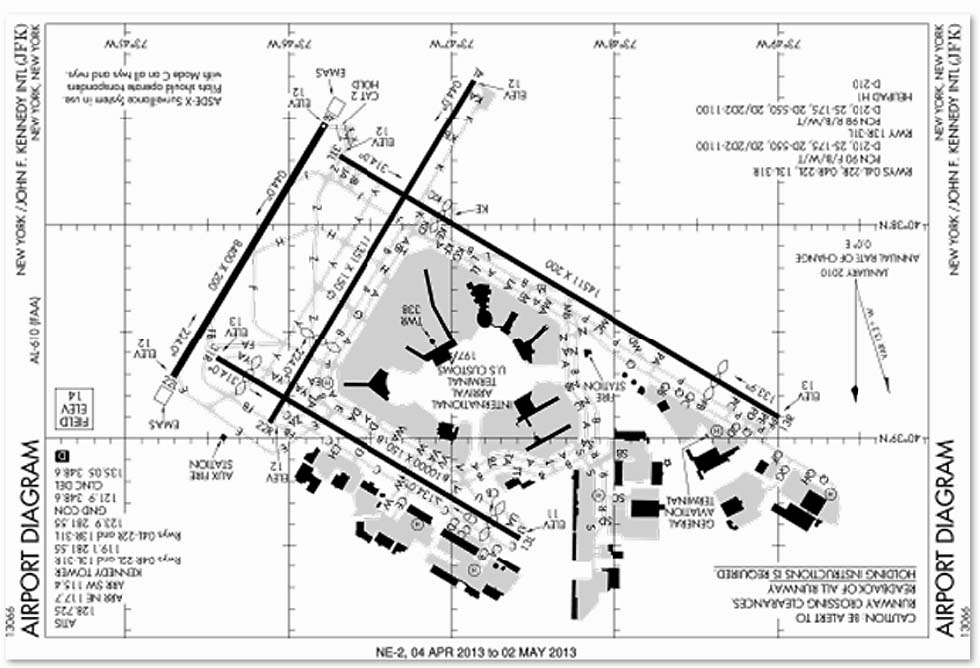
In 1966 the busiest airports, ranking by the total number of passengers per annum, were Chicago O’Hare with 24 million, New York JFK with 20 million, Los Angeles with 18 million and London Heathrow with 12 million.
In 2000, the top 10 airports by passenger numbers, plus some leaders within their region: 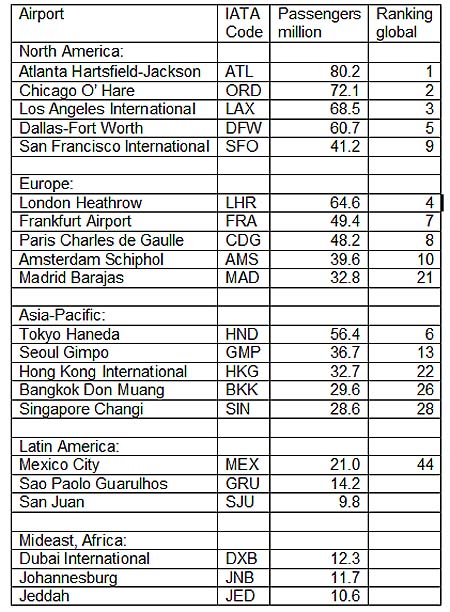
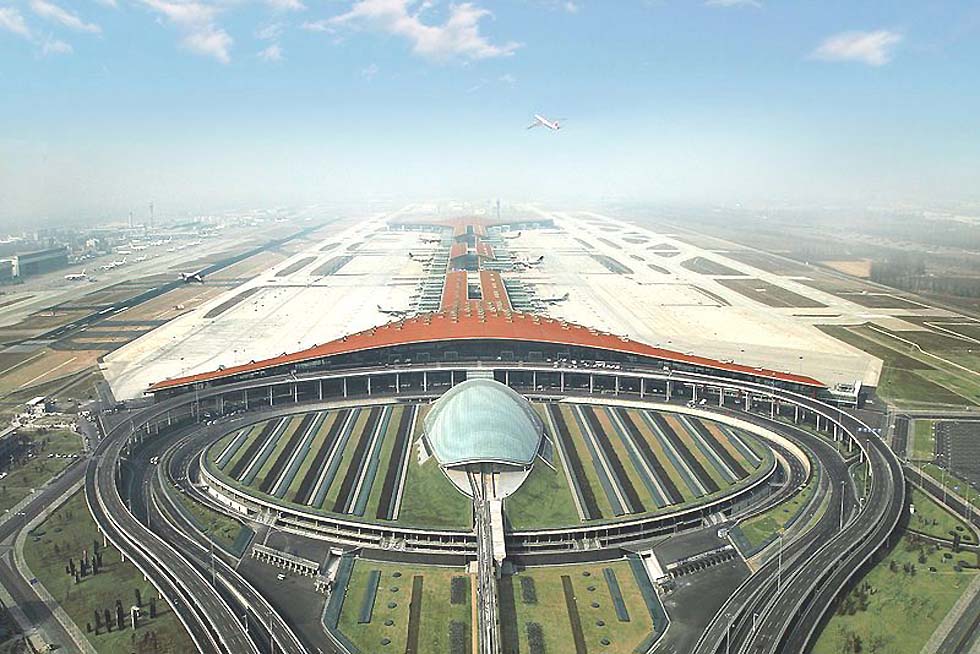
In 2016 the top airports by passenger numbers, in accordance with Airports Council International, via Wikipedia: 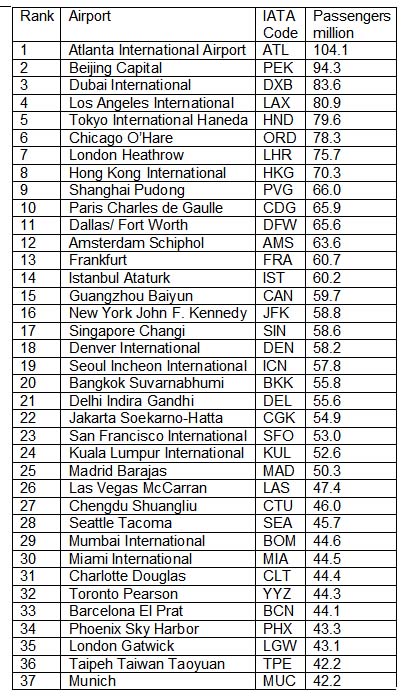 Airports are mentioned with their best-known name, not necessarily the official name. The traditional IATA code is given, not the unpopular ICAO code. 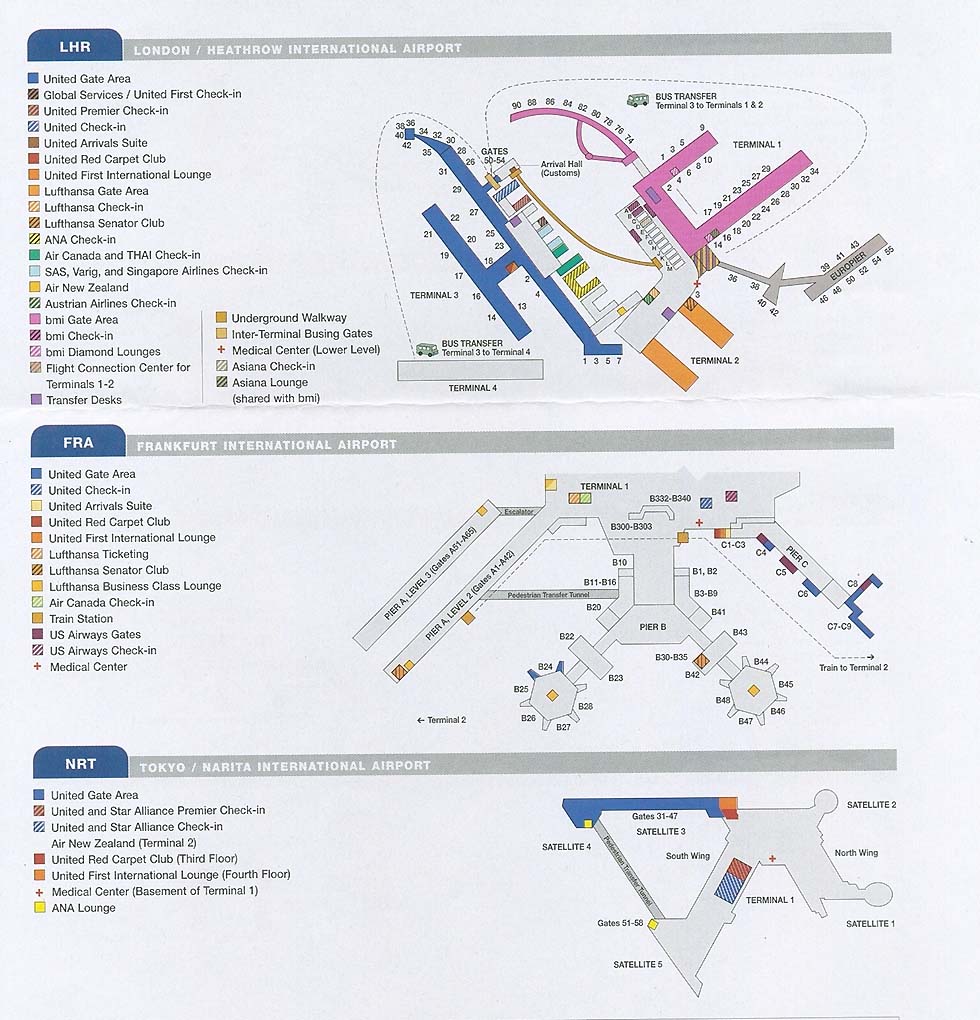 London Heathrow, Frankfurt and Tokyo Narita in 2008 (courtesy United Airlines) 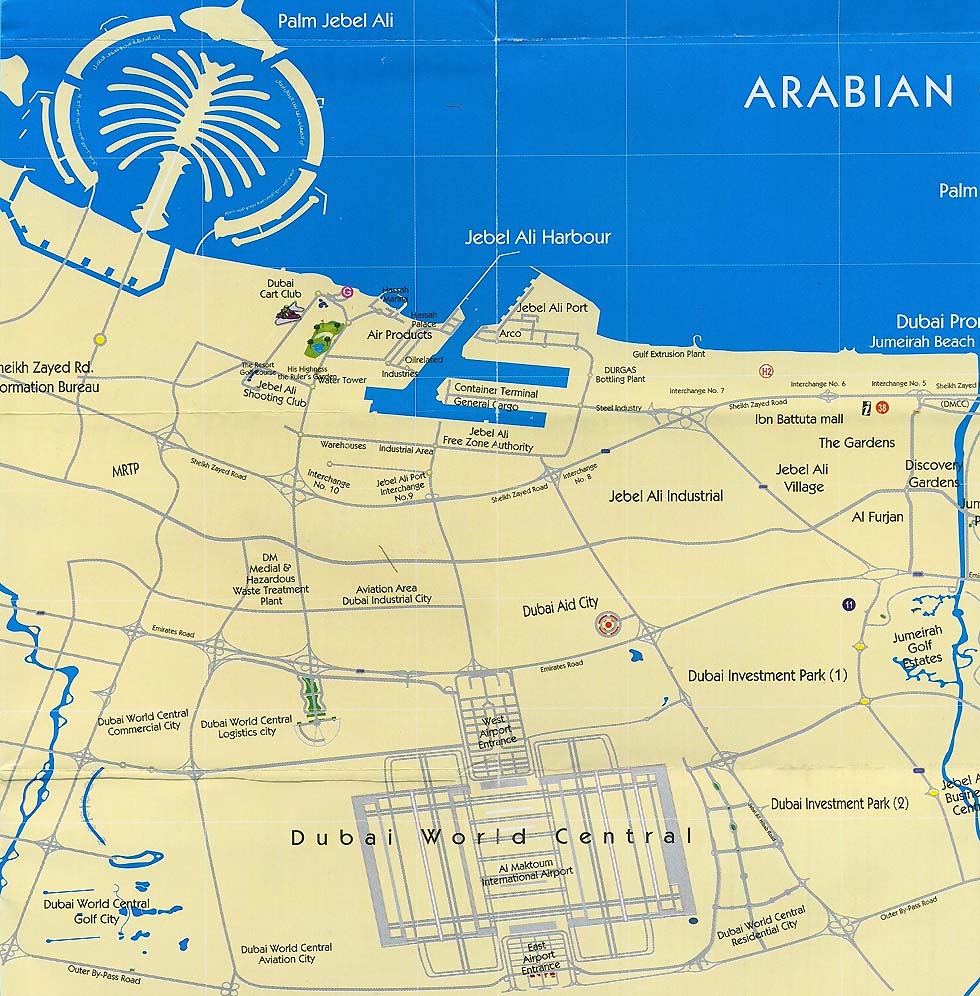 Dubai World, Al Maktoum International (official publication, 2014) In 2000, among the top 20 were 14 US airports, 4 European airports and 2 of the Asia/ Pacific region. The statistics of 2010 showed changes: Beijing had leapt to rank 2 and Dubai from “nowhere” to rank 13. In the 2010 statistics, among the top 20 were 8 airports of the Asia-Pacific region, 6 US airports, 5 European and 1 Mideast airport. The strongest step forward has made Shanghai Pudong, from rank 34 to rank 20. By 2012, Jakarta Soekarno-Hatta has leapt to rank 9, followed by Dubai, while Madrid has fallen back. With Delhi on rank 37 and Sao Paolo Guarulhos on rank 43 in that year, other regions stayed still behind. Sao Paolo Guarulhos and Moscow Domodedovo (in 2013 occupying rank 50 with 30.8 million passengers) left the top 50. In 2016 Delhi had a plus of 21%, Doha 20%, Seoul 17% and Kunming 12%. For Johannesburg a number of barely 15 million passengers was reported in 2016. With a double-digit growth rate of airports in the Asia region, a change in statistics is always on the program. In January 2014 Beijing had 7 million passengers during that month, surpassing Atlanta with its 6.8 million. But in 2014 Atlanta once again has become the leader with 96 million passengers, ahead of Beijing with its 86 million. A rising traffic share was reported for India. And concerning the cities, it should not be forgotten that e.g. Tokyo, Shanghai, London, Paris, New York or other trading centres have more than one international airport, thus being the leading cities by air traffic.
|